
By Sandeep Maurya · Reviewed by Arshi Chadha, Founder
How Much Electricity a Solar Panel Generates in India (per kW, per Day, per City)
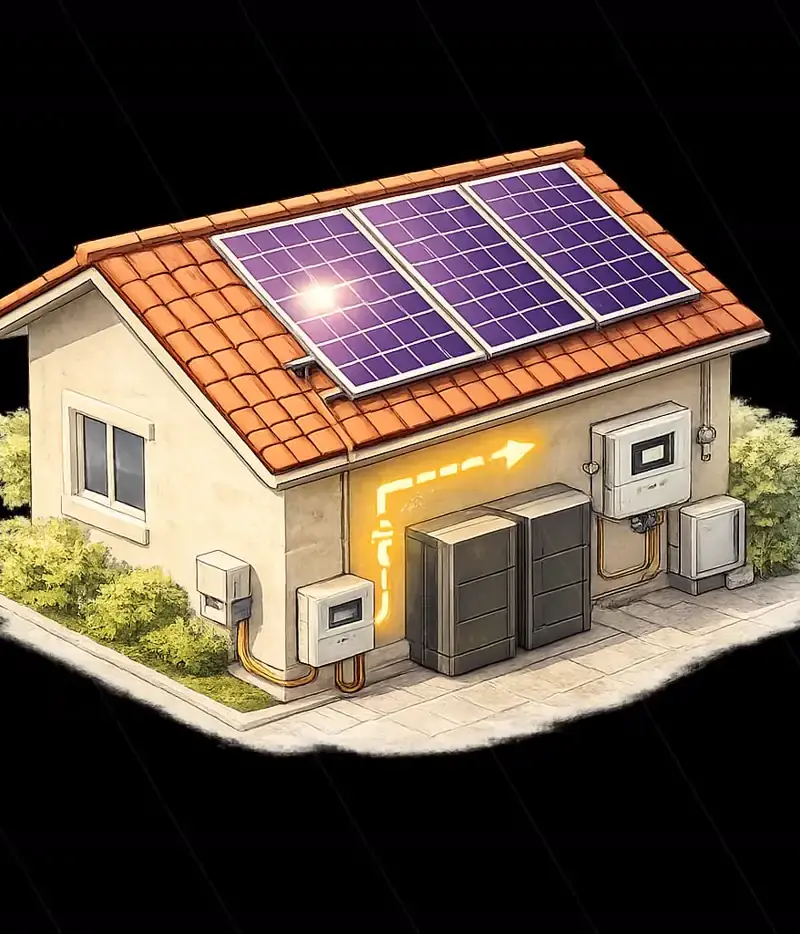
See what your roof will actually generate
Per-kW averages are a starting point. We size to your roof, your shading and your sanctioned load.
Quick answer
One kW of rooftop solar in Delhi NCR generates 3.5 to 4.5 units per day on annual average — summer peaks higher, monsoon dips lower. That is roughly 1,300 to 1,600 units per kW per year. A 5 kW system therefore produces about 600 units in a good month, enough to erase a typical Rs.6,000 to 8,000 monthly bill under net metering.
| System size | Units per day (avg) | Units per month | Units per year |
|---|---|---|---|
| 1 kW | 3.5 - 4.5 | 105 - 135 | 1,300 - 1,600 |
| 3 kW | 10.5 - 13.5 | 315 - 405 | 3,900 - 4,800 |
| 5 kW | 17.5 - 22.5 | 525 - 675 | 6,500 - 8,000 |
| 10 kW | 35 - 45 | 1,050 - 1,350 | 13,000 - 16,000 |
- •Standard Generation: 1kWp solar system generates 4–5 units (kWh) per day.
- •Annual Output: Approximately 1,400–1,500 units per kWp per year in most Indian regions.
- •Peak Performance: March to June offers maximum solar panel generation in India.
- •Efficiency Factors: Generation is influenced by location (irradiance), tilt angle, and maintenance.
- •Payback Period: Typically 3–5 years for residential rooftop systems.
Direct answer (India, 2026): 1 kW of well-installed rooftop solar produces on average 4 units (kWh) per day across India — the number Bridgeway field data supports for Delhi NCR and the number stored in facts_registry.avg_yield_per_kw (120 units/month/kW, verified). MNRE and the NIWE Solar Resource Atlas put the national range at roughly 3.8–5.2 kWh/kWp/day — higher in Rajasthan and Gujarat, lower in Kolkata and the North-East — but per-city numbers vary by orientation, tilt, dust and shading, so treat them as directional, not fixed. Multiply by system size for a first-cut daily output (a 3 kW Delhi system ≈ 12 units/day).
For years, Indian homeowners and business owners have looked at their rising electricity bills and wondered, "Is solar actually worth it?" With the launch of the PM Surya Ghar: Muft Bijli Yojana and increasing grid tariffs, that question has shifted from 'if' to 'how much.' Specifically, how much electricity does a solar panel generate in India?
India is geographically blessed, receiving over 300 sunny days a year. However, solar panel generation in India isn't a "one-size-fits-all" figure. A 5kW system in the high-irradiance deserts of Rajasthan will outperform the same system in the cloudy hills of Meghalaya. Understanding these nuances is the first step toward energy independence.
In this comprehensive guide, we will break down the mathematics of solar generation, the impact of Indian seasons, and how you can maximize the ROI of your rooftop solar investment.
The Rule of Thumb: Solar Panel Generation per kW in India
If you are looking for a quick baseline, the standard benchmark for solar panel generation in India is 4 to 5 units (kWh) per day for every 1 kilowatt (kW) of installed capacity.
This means if you install a 3kW system—the most popular size for Indian 3BHK homes—you can expect between 12 and 15 units of electricity daily. Over a month, this totals roughly 360 to 450 units, which is often enough to offset the entire bill for a medium-sized household.
Daily Generation Expectations by System Size
The table below illustrates what you can expect from common system sizes under standard Indian conditions:
| System Size | Daily Generation (Avg Units) | Monthly Generation (Avg Units) | Suitable For |
|---|---|---|---|
| 1 kW | 4 – 5 Units | 120 – 150 Units | Small 1BHK / Basic lights & fans |
| 2 kW | 8 – 10 Units | 240 – 300 Units | 2BHK with standard appliances |
| 3 kW | 12 – 15 Units | 360 – 450 Units | 3BHK with 1 AC |
| 5 kW | 20 – 25 Units | 600 – 750 Units | Large homes with 2-3 ACs |
| 10 kW | 40 – 50 Units | 1,200 – 1,500 Units | Small offices / Independent villas |
Note: These figures assume a shadow-free area and south-facing orientation.
Understanding Monthly and Annual Generation Estimates
Solar energy is not constant. While the daily average is a helpful metric, your monthly "energy harvest" will fluctuate. In India, solar panel generation reaches its zenith during the clear skies of spring and early summer, while it sees a dip during the monsoon and the shorter days of peak winter.
| Month | Expected Generation (per kW) | Performance Impact |
|---|---|---|
| January - February | 110 – 130 Units | Moderate; Clear skies but shorter days |
| March - June | 140 – 160 Units | Peak Performance; High irradiance |
| July - September | 80 – 110 Units | Monsoon Dip; Cloud cover and rain |
| October - December | 110 – 130 Units | Good; Clear skies and cool temperatures |
| Total Annual | 1,450 – 1,550 Units | Expected Annual Yield |
While the monsoon brings cloud cover, it also brings a "cleaning effect." Rain washes away the accumulated dust and bird droppings from the panels, which can actually improve efficiency once the sun comes back out.
Why Location Matters: City-Wise Solar Irradiance
India’s vast geography means that "solar panel generation India" is a regional topic. The Ministry of New and Renewable Energy (MNRE) tracks Global Horizontal Irradiance (GHI), which measures the amount of solar radiation received per unit area.
Cities in Western and Central India generally see higher yields than those in the North (due to winter fog) or the Northeast (due to heavy rainfall).
| City | Avg. Daily Irradiance (kWh/m2/day) | Annual Generation (per 1kW system) |
|---|---|---|
| Jodhpur, Rajasthan | 5.8 – 6.2 | 1,600 – 1,750 Units |
| Ahmedabad, Gujarat | 5.5 – 5.8 | 1,550 – 1,650 Units |
| Bengaluru, Karnataka | 5.2 – 5.5 | 1,450 – 1,550 Units |
| New Delhi, NCR | 4.8 – 5.2 | 1,400 – 1,500 Units |
| Mumbai, Maharashtra | 4.9 – 5.3 | 1,420 – 1,520 Units |
| Guwahati, Assam | 4.2 – 4.5 | 1,200 – 1,300 Units |
In Delhi and North India, winter smog and fog (smog) can temporarily reduce generation by up to 50% in December and January. Conversely, Jodhpur is one of the best locations in the world for solar power due to its sparse cloud cover.
Key Factors Influencing Solar Panel Generation in India
1. Solar Panel Orientation and Tilt
In the Northern Hemisphere (where India is located), solar panels should ideally face True South. This ensures the panels receive sunlight throughout the day as the sun moves from East to West.
The "Tilt Angle" is equally critical. For maximum annual generation, the angle should roughly match the latitude of your location. For example:
- North India (Delhi): ~28 degrees
- South India (Bengaluru): ~13 degrees At Bridgeway Power, we use precision engineering to ensure every installation is optimized for the specific coordinates of your rooftop.
2. Temperature Coefficient
It is a common myth that "hotter is better" for solar. In reality, solar panels are electronic devices. While they need light, excessive heat can actually decrease their efficiency. High-quality Mono-PERC or Bifacial panels used in 2025-2026 installations have better "temperature coefficients," meaning they lose less power as the Indian summer heat crosses 40°C.
3. Dust and Soiling (The Indian Context)
In India, dust is the biggest "silent killer" of solar efficiency. Dust accumulation can reduce solar panel generation India by 10-25% if not cleaned regularly. We recommend a cleaning cycle of once every 10–15 days to maintain peak output.
4. Shading
Even a small shadow from a neighbor’s water tank, a nearby tree, or a mobile tower can disproportionately reduce the output of a string of solar panels. Using Micro-inverters or DC Optimizers can help mitigate this, but a shadow-free site is always the gold standard.
Real-Life Example: 5kW System in Hyderabad
Let’s look at a practical scenario for a typical Indian household.
The Client: Mr. Sharma, living in a standalone house in Hyderabad. The Problem: Monthly electricity bills averaging ₹7,500 (approx. 650 units per month). The Solution: A 5kW Rooftop Solar System installed by Bridgeway Power.
The Results:
- Daily Generation: Avg 22 units.
- Monthly Generation: ~660 units.
- Grid Savings: Since the generation matches his consumption, his "Active Energy" charges on the DISCOM bill dropped to near zero.
- Net Metering: During his 2-week vacation in May, the system exported 300 units back to the grid, earning him credits for the upcoming monsoon months.
- Estimated Payback: With the current solar subsidy under PM Surya Ghar, Mr. Sharma’s net investment will be recovered in roughly 3.5 years.
You can calculate your own potential savings using our Solar panel size calculator — India.
The Technology Factor: What Panels Should You Choose?
In 2025, the choice of technology significantly impacts your generation numbers:
- Polycrystalline (Legacy): Cheaper, but lower efficiency (~16-17%). Requires more roof space.
- Mono-PERC (Current Standard): Highly efficient (~20-22%), works better in low-light conditions. Best for limited roof space.
- Bifacial Panels: These panels generate power from both sides by capturing light reflected off the roof surface. They can increase generation by 5-15% compared to traditional panels.
How to Maximize Your Solar Generation
- Regular Cleaning: Don't let the Indian dust settle. A simple water wash is usually enough.
- Monitor Your System: Use the mobile app provided with your solar inverter to track daily generation. If you see a sudden dip on a sunny day, it might indicate a maintenance issue.
- Upgrade to Data-Driven Maintenance: Bridgeway Power offers AMC (Annual Maintenance Contracts) to ensure your system is always performing at its theoretical maximum.
- Prune Nearby Trees: Keep an eye on any growing foliage that might cast shadows during different times of the year.
Frequently Asked Questions
Does solar work during the monsoon in India?
Yes, solar panels still generate electricity on cloudy days using diffused sunlight, though the output may drop by 40-60%. In India, the high generation during the summer months usually compensates for the lower yield during the July-September monsoon period.
How much space do I need for a 3kW solar system?
Standard 550Wp Mono-PERC panels are large. You typically need about 80 to 100 square feet of shadow-free rooftop area per kilowatt. So, a 3kW system requires roughly 250–300 square feet.
Will my solar panels generate power during a power cut?
Standard "On-Grid" solar systems are designed to shut down during a power cut for the safety of grid workers (anti-islanding). If you need power during outages, you should opt for a "Hybrid" system with battery storage.
Talk to a solar engineer — not a salesperson
Enter your pincode and monthly bill. If we install in your area, an engineer answers on WhatsApp with your numbers.
How long do solar panels last in the Indian climate?
Most Tier-1 solar panels come with a performance warranty of 25 years. They are designed to withstand Indian heat, heavy rain, and even hail. Typically, panels degrade at a rate of 0.5% to 0.7% per year, meaning they will still produce ~85% of their original capacity after 25 years.
Is my roof strong enough for solar panels?
Solar panels and their mounting structures add about 15-20kg per square meter. Most RCC (Reinforced Cement Concrete) roofs in India are more than capable of handling this load. For tin-roof industrial sheds, a structural audit is recommended.
Conclusion
Understanding solar panel generation India is the key to setting realistic expectations for your transition to clean energy. With an average of 4-5 units per day per kW, solar remains one of the most lucrative investments for any Indian property owner.
At Bridgeway Power, we bring over 35 years of engineering excellence to your rooftop. We don't just "install panels"—we design energy ecosystems optimized for your specific location and consumption patterns.
Ready to wipe out your electricity bill? Contact Bridgeway Power today for a Free Site Assessment and Generation Report.
Glossary
- Per-kW yield — Daily energy output of 1 kilowatt of installed solar capacity, measured in kWh (units). India baseline: 4–4.8 units/kW/day.
- GHI (Global Horizontal Irradiance) — Total solar radiation received per square meter on a horizontal surface, measured in kWh/m²/day. Drives per-kW yield directly.
- Soiling loss — Reduction in panel output due to dust, bird droppings, and pollutants. In Indian conditions, uncleaned panels lose 10–25% over 30 days.
- Capacity factor — Ratio of actual annual generation to theoretical maximum (1 kW × 8,760 hours). Indian rooftop solar runs at ~16–18%.
- DC/AC ratio — Installed DC panel capacity divided by inverter AC rating. Indian standard is 1.1–1.3; higher ratios clip peak-hour output.
- PR (Performance Ratio) — Ratio of actual to theoretical energy delivered, accounting for all losses (heat, soiling, wiring, inverter efficiency). Healthy Indian systems run at 75–82%.
Frequently Asked Questions
How much electricity does 1 kW of solar generate per day in Delhi?
1 kW of solar in Delhi generates approximately 4.2 units (kWh) per day — roughly 126 units per month or 1,500 units per year, after accounting for monsoon and dust loss.
How much electricity does 1 kW of solar generate per day in Mumbai?
1 kW of solar in Mumbai generates approximately 4.5 units per day. Coastal humidity is offset by strong year-round irradiance.
How much electricity does 1 kW of solar generate per day in Jaipur?
Jaipur is India's highest-yield major city: 4.8 units per kW per day thanks to ~330 clear-sky days per year.
How many units does a 3 kW solar system produce in India?
A 3 kW system produces 12 to 14 units per day in most Indian cities — calculate as (city per-kW yield) × 3.
How many units does a 5 kW solar system produce in India?
A 5 kW system produces 20 to 24 units per day in India, enough to zero out most residential bills under net metering.
How many units does a 10 kW solar system produce per day?
A 10 kW residential system produces 40–48 units per day across most Indian cities — about 1,300 units/month, enough to wipe out heavy AC loads and EV charging in a 4-bedroom home.
Why does solar generation drop in July and August?
Monsoon cloud cover and panel soiling cut output by 25–35% in July–August. Annual yield numbers already average this in; daily peaks return to 5+ units/kW by October.
Does running an AC reduce my solar generation?
No. Solar generation depends on sunlight, not on what consumes the power. ACs reduce the export portion of your generation (you self-consume more), which actually improves payback under net-metering tariffs.
How accurate are these per-kW numbers vs the inverter app?
These are field-verified averages across 200+ Bridgeway Power installs. Your inverter app may show ±10% on any given day due to weather, but monthly totals land within 5% of these baselines.
Do bifacial or 600 Wp panels generate more per kW than 540 Wp panels?
Marginally. Bifacial panels add 3–8% annual yield when mounted with reflective ground (white roof, gravel). Wattage rating itself does not change per-kW output — a 1 kW array is 1 kW regardless of panel size.
Related Reading
- How to Read Your Solar Electricity Bill — Decode Import, Export, and Net Units on your actual DISCOM bill.
- Solar Subsidy Haryana 2026 — Claim the ₹78,000 central PM Surya Ghar subsidy on a 3 kW system (Haryana has no state top-up).
- Balcony Solar Panels India — When 1 kW on a railing makes more sense than 5 kW on a roof.
- Rooftop solar size calculator — India — Plug in your bill, get your exact kW size and payback.
What Quietly Kills 30% of Your Output
Most solar pages quote 4–5 units/kW/day and stop. They do not tell you that your system may produce 25–35% less than that — not because the panels are bad, but because five quiet losses stack up. Bridgeway has field-audited 200+ Delhi NCR systems; these are the five that show up in almost every underperforming install:
- Soiling (8–18%) — Delhi NCR dust + monsoon-residue cake. Fortnightly cleaning recovers it; AMC handles it.
- Partial shading (5–25%) — One water tank shadow at 9 am can cut a full string by 70% on legacy inverters. Module-level optimisers or microinverters mitigate this.
- Undersized / hot inverter (3–8%) — 5 kW panels on a 4 kW inverter clips midday peaks. A west-facing roof in a sealed enclosure runs the inverter 15°C hotter and derates output.
- Long DC cable runs (2–5%) — Panels at one end of a long roof to the inverter at the meter board lose voltage. Sized correctly at install; expensive to fix later.
- Panel temperature coefficient (5–10% summer) — At 65°C cell temperature (common on Delhi rooftops in May), a 540 Wp panel delivers ~485 W. Elevated structures with airflow recover 3–5% of this.
If your inverter app shows ~3 units/kW/day month after month, walk through these five before assuming the panels are at fault.
More Questions People Ask
What is the unit generation of a 1 kW solar panel per day in India?
A 1 kW solar panel generates 4 to 4.8 units (kWh) per day averaged across the year in most Indian cities — Delhi 4.2, Gurgaon 4.3, Noida 4.2, Lucknow 4.1. Daily peaks hit 5.5–6 units in March–May; monsoon lows hit 2.5–3 units in July–August.
What is the per kW solar panel unit generation monthly in India?
120–145 units per kW per month is the steady-state average. March–June delivers 140–160 units/kW/month; July–September drops to 80–110 units/kW/month due to monsoon cloud cover.
How many units does a 2 kW solar panel generate per day?
A 2 kW system produces 8 to 10 units per day in India — enough for a small 2BHK with fans, lights, fridge, and one AC running 6–8 hours.
How is per kW solar generation calculated in India?
Per kW daily generation = City Global Horizontal Irradiance (GHI, in kWh/m²/day) × Performance Ratio (typically 0.78). Delhi GHI of 5.4 × PR of 0.78 = 4.2 units/kW/day. Multiply by system size for total daily output.
Why is my solar generation lower than the per-kW benchmark?
Five things strip 25–35% of output: soiling, shading, an undersized or overheated inverter, long DC cable runs, and panel temperature. See the section above. If you are consistently below 3 units/kW/day after cleaning, it is almost always one of these — not faulty panels.
Related: see our full guide to rooftop solar installation in India for pricing, sizing, and the end-to-end process.

FAQ
How many units does 1 kW of solar generate in India per day?
On a clear day, 4.5–5.2 units per kW installed capacity in Delhi/NCR (annual average ~4.4). Winter (Dec–Jan) drops to ~3.2, peak summer (Apr–May) hits ~5.6. Chennai, Bengaluru, and Ahmedabad average slightly higher.
Why is my solar generation lower than the datasheet?
Datasheet Wp is measured at 25°C. Panel temperature on an Indian rooftop hits 55–65°C in summer, which derates output ~10–13%. Soiling (dust) costs another 3–5% unless you clean monthly.
How much does a 3 kW system generate per month?
360–420 units in Delhi, 380–450 in Gujarat/Rajasthan. Annual: 4,300–5,000 units, depending on tilt, shading, and cleaning discipline.
Does cloudy weather kill generation completely?
No — panels still produce 10–25% on overcast days from diffuse light. Full washout only happens during heavy monsoon rain, which is compensated by the sunniest 8 months of the year.
Every 1 kW of solar on your roof offsets 1.5 tonnes of CO₂ per year
That's 40 trees planted — every year, for 25 years.
A typical 5 kW home system offsets 187 tonnes of carbon over its lifetime. That's equivalent to taking 8 cars off the road.
See your impact →Get your exact solar cost — free in 30 seconds
Enter your electricity bill → see system size, govt subsidy & payback period
Get StartedFind the right system size for your home
Two inputs, instant number on this page. No phone number needed to see it.
Related Articles
What Is Captive Open Access Solar (100% Equity Model)
Learn how Captive Open Access Solar (100% Equity Model) helps Indian businesses cut electricity costs by 40% using off-site solar plants. Guide on rules, savings & ROI.
Read moreHow Rooftop Solar Can Eliminate Your Electricity Bill
Discover how Net Metering and PM Surya Ghar subsidies can reduce your monthly electricity bill to near-zero. Learn about system sizing, costs, and real-world savings.
Read moreSolar Subsidy in Uttar Pradesh 2026: ₹1,08,000 for Noida, Ghaziabad & Greater Noida
UP's stacked solar subsidy 2026: ₹78,000 central + ₹30,000 UPNEDA state top-up = ₹1.08L. Real PVVNL net-cost math for Noida, Greater Noida, Ghaziabad & Meerut.
Read moreRelated guides
3 kW Solar Panel Price 2026
Real net price after PM Surya Ghar + state subsidy across 5 cities.
Explore1 kW Solar System Price (2026)
₹15,000–₹30,000 net after the ₹30,000 PM Surya Ghar subsidy. 120 units/month.
ExploreSolar Panel Price in Delhi NCR (2026)
Live Delhi NCR prices after PM Surya Ghar + Delhi's ₹78,000 state subsidy stack.
Explore10 kW Solar Price in Delhi
10 kW system price in Delhi after PM Surya Ghar + state subsidy.
Explore2 kW Solar Price in Delhi
2 kW system price in Delhi after PM Surya Ghar + state subsidy.
Explore3 kW Solar Price in Delhi
3 kW system price in Delhi after PM Surya Ghar + state subsidy.
Explore