
By Mahendra Singh · Reviewed by Arshi Chadha, Founder
Solar vs Electricity Bills in India: Which Is Cheaper in 2026?
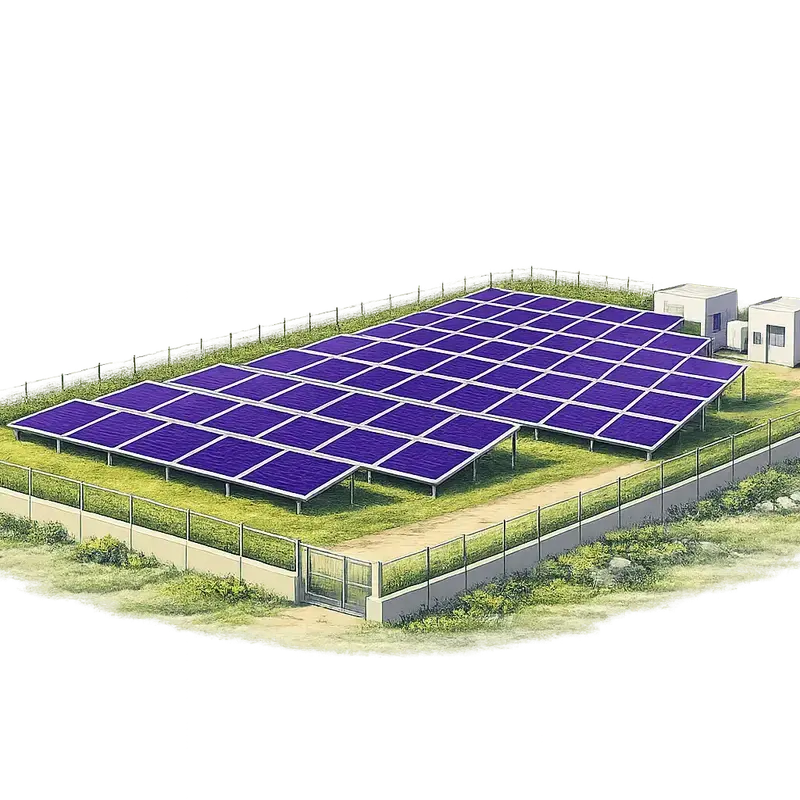
- •Grid vs Solar Cost: Grid electricity ranges from ₹7–12/unit; Solar LCOE is approx. ₹2.2–2.8/unit.
- •Investment: A 5kW system costs ~₹1.8–2.2 Lakh after PM Surya Ghar subsidy.
- •ROI: Payback period is now 3–4 years for most Indian residential consumers.
- •25-Year Savings: A typical household can save over ₹15–20 Lakhs compared to grid bills.
You're checking the rate — now see how much of your bill solar erases
For decades, Indian homeowners and businesses viewed rooftop solar as a luxury or an environmental "good deed." However, as we head into 2026, the narrative has shifted completely. Solar is no longer just a green alternative; it is a financial necessity. With electricity tariffs in states like Maharashtra, Karnataka, and Delhi touching record highs, the question isn't just about saving the planet—it's about saving your bank balance.
In this comprehensive guide, we analyze the solar vs grid electricity cost in India to determine which is cheaper in 2026. We will look at rising electricity tariffs, the Levelized Cost of Energy (LCOE), and why the "wait and watch" approach is costing you thousands of rupees every month.
The Rising Burden of Grid Electricity in India (2026 Context)
Electricity in India is getting more expensive every year. While the government strives for universal electrification, the operational costs of thermal power plants, coal imports, and the massive debt of state DISCOMs (Distribution Companies) are passed directly to the consumer.
Most Indian states follow a "slab-based" billing system. If you use more than 300 units a month, you likely fall into the highest bracket, paying anywhere from ₹8 to ₹12 per unit. When you add fixed charges, FPPCA (Fuel Price and Power Purchase Cost Adjustment), and electricity duty, your effective rate is often much higher than the base tariff.
Table 1: Grid Electricity Cost vs. Solar LCOE (2026 Estimates)
| Parameter | Grid Electricity (DISCOM) | Solar Rooftop (Residential/C&I) |
|---|---|---|
| Average Cost per Unit | ₹7.00 – ₹11.50 | ₹2.20 – ₹2.80 |
| Price Stability | Volatile (8-10% annual hike) | Fixed for 25 years |
| Additional Charges | Taxes, Cess, Fixed Charges | Minimal Maintenance |
| Long-term Trend | Exponentially Increasing | Free after 4 years |
Why Solar vs Grid Electricity Cost in India Favors Solar
The primary reason solar wins the "solar vs grid electricity cost India" debate in 2026 is the Levelized Cost of Energy (LCOE).
What is Solar LCOE?
LCOE is the average cost of power generation over the entire lifetime of the system. To calculate it, you take the total cost of installing and maintaining the solar plant and divide it by the total units it will produce over 25 years.
Because sunshine is free and solar panels have no moving parts, the "fuel" cost is zero. In 2026, with high-efficiency TOPCon and Mono-PERC modules, the LCOE of a residential rooftop system in India has dropped to roughly ₹2.50 per unit. Compare this to a grid rate of ₹9.00 per unit, and solar is effectively 70% cheaper from day one.
The 8-10% Annual Tariff Hike: The Silent Budget Killer
Many homeowners calculate their solar savings based on today's electricity bill. This is a mistake. DISCOMs in India typically increase tariffs by 8% to 10% annually to cover inflation and infrastructure costs.
Table 2: Electricity Tariff Escalation Trend (Projected)
| Year | Current Grid Rate (Base ₹8/unit) | Solar Rate (Locked-in) |
|---|---|---|
| Year 1 (2026) | ₹8.00 | ₹2.50 (LCOE) |
| Year 5 (2030) | ₹11.71 | ₹2.50 |
| Year 10 (2035) | ₹18.86 | ₹2.50 |
| Year 20 (2045) | ₹48.91 | ₹2.50 |
By 2045, you could be paying nearly ₹50 per unit to the grid due to compounding inflation, while your solar system—which you paid off in 2030—continues to provide power for free. Use our solar calculator to see how these hikes affect your specific monthly bill.
Break-Even Analysis: When Does Solar Become "Free"?
With the PM Surya Ghar: Muft Bijli Yojana, the Indian government provides a massive subsidy of up to ₹78,000 for residential rooftop systems up to 3kW. This has slashed the break-even point (payback period) significantly.
For a typical 5kW system:
- Total Investment: ~₹3,00,000
- Subsidy: ~₹78,000
- Net Cost: ~₹2,22,000
- Monthly Generation: ~600 Units
- Monthly Savings (at ₹9/unit): ₹5,400
- Annual Savings: ₹64,800
- Payback Period: ~3.4 Years
After approximately 40 months, the system has completely paid for itself. For the remaining 21 years of the panel warranty, the electricity generated is 100% profit.
25-Year Cost Comparison: Grid vs. Solar
To truly understand which is cheaper, we must look at the cumulative spend over the 25-year guaranteed lifespan of a solar system.
Table 3: 25-Year Cumulative Cost Comparison (5kW System)
| Feature | Grid Electricity (with 8% hike) | Solar Rooftop System |
|---|---|---|
| Initial Investment | ₹0 | ₹2,22,000 (after subsidy) |
| Year 1 Expense | ₹64,800 | ₹5,000 (O&M) |
| Year 10 Cumulative | ₹9,38,000 | ₹2,72,000 (Incl. Inverter replacement) |
| Year 25 Cumulative | ₹47,30,000 | ₹3,50,000 |
| TOTAL SAVINGS | - | ₹43,80,000 |
The difference is staggering. By choosing grid electricity, you are essentially committing to pay nearly ₹47 Lakhs over the next two decades for a basic necessity. By switching to solar, you lock in your costs at a fraction of that amount.
Talk to a solar engineer — not a salesperson
Check whether we install in your area, then get your answer on WhatsApp. No forms, no call centre.
See how much of this bill solar erases
Real-World Example: The Sharma Family in Noida
Let’s look at a practical application of the solar vs grid electricity cost India comparison.
The Sharma family lives in a 3BHK house in Noida. In the summer of 2025, their monthly bill averaged ₹9,500 due to heavy AC usage. Their average cost per unit was ₹8.50.
They contacted Bridgeway Power for a 5kW rooftop installation.
- System Size: 5kW Mono-PERC Half-cut modules.
- Upfront Cost: ₹2,15,000 (after PM Surya Ghar subsidy).
- Outcome: Their monthly bill dropped from ₹9,500 to the minimum fixed charge of ~₹400.
- Annual Savings: Over ₹1,00,000.
- Future-Proofing: While their neighbors complained about the 2026 tariff hike, the Sharmas remained unaffected. They have already recovered 30% of their investment in the first year alone.
Factors That Influence Solar Affordability in 2026
While solar is generally cheaper, certain variables can change the math for your specific home:
1. Solar Exposure and Shadowing
If your roof is shaded by neighboring buildings or trees, your generation will drop. Bridgeway Power uses 3D shadow analysis to ensure panels are placed for maximum yield.
2. Net Metering Policies
The "Net Metering" policy of your state (such as BESCOM in Karnataka or TATA Power in Delhi) determines how much credit you get for the excess energy you send back to the grid. In 2026, most states have streamlined this process, making solar even more attractive.
3. Quality of Components
Cheap, unbranded panels might save you ₹20,000 today but will degrade faster, increasing your LCOE over time. Investing in Tier-1 modules with a 25-year warranty ensures your cost-benefit analysis remains accurate.
Why 2026 is the Peak Year to Switch
There are three reasons why 2026 is the "Sweet Spot" for solar in India:
- Technology Maturity: N-type TOPCon panels have reached peak efficiency (22%+), meaning you need less roof space for more power.
- Stable Subsidies: The PM Surya Ghar scheme is at its peak funding stage.
- Financing Options: Solar loans are now available at interest rates lower than personal loans (approx. 8-10%), making the "Initial Investment" hurdle almost non-existent.
Frequently Asked Questions
Is solar really cheaper than grid electricity in India?
Yes. In 2026, the average cost of solar power (LCOE) is approximately ₹2.50 per unit, whereas grid electricity for domestic consumers in most urban areas ranges from ₹7 to ₹12 per unit. Solar is effectively 70-80% cheaper over its lifespan.
How much does a 3kW solar system cost in India in 2026?
A 3kW system typically costs between ₹1,60,000 and ₹1,90,000. After the PM Surya Ghar subsidy of ₹78,000, your effective investment is approximately ₹82,000 to ₹1,12,000.
What is the lifespan of a solar rooftop system?
Modern Tier-1 solar panels come with a performance warranty of 25 years. While the inverter may need replacement or servicing after 10-12 years, the panels will continue to produce electricity (at about 85% of their original capacity) for over two decades.
Will solar work during power cuts?
Standard "On-Grid" solar systems shut down during power cuts for safety reasons (Anti-islanding). However, "Hybrid" systems with battery storage allow you to use solar power even during grid outages, though they come with a higher initial cost.
How long does it take to get a return on investment (ROI)?
For residential consumers in India, the ROI or payback period is currently 3 to 4 years. For commercial and industrial (C&I) clients who pay higher tariffs, the payback can be as short as 2.5 to 3 years.
Conclusion: Stop Paying for "Rising Tariffs"
The debate of solar vs grid electricity cost in India has a clear winner. Grid electricity is an escalating expense that offers no return, while solar is an asset that pays for itself in less than four years.
By continuing to rely solely on the grid, you are exposing your household or business to 8-10% annual price hikes indefinitely. By switching to solar in 2026, you lock in a rate of ~₹2.50 per unit for the next 25 years.
Ready to wipe out your electricity bills? At Bridgeway Power, we bring 35+ years of engineering excellence to your rooftop. Calculate your exact savings or contact us today for a free site assessment and customized solar quote. Let’s make 2026 the year you stop paying for power and start owning it.
Every 1 kW of solar on your roof offsets 1.5 tonnes of CO₂ per year
That's 40 trees planted — every year, for 25 years.
A typical 5 kW home system offsets 187 tonnes of carbon over its lifetime. That's equivalent to taking 8 cars off the road.
See your impact →Get your exact solar cost — free in 30 seconds
Enter your electricity bill → see system size, govt subsidy & payback period
Get StartedLiked this article? Get a free solar quote
Tell us about your rooftop — we'll call with exact savings for your home.
Related Articles
Net Metering in India: How to Sell Solar Power Back to the Grid
Learn how net metering in India allows you to sell solar power back to the grid. Discover state policies, savings examples, and how to reduce your bill by 90%.
Read moreWhat Is Captive Open Access Solar (100% Equity Model)
Learn how Captive Open Access Solar (100% Equity Model) helps Indian businesses cut electricity costs by 40% using off-site solar plants. Guide on rules, savings & ROI.
Read moreSolar Installation Cost in Delhi NCR 2026: 3 kW at ₹1.32L net
Updated 2026 guide to solar costs in Delhi NCR. Learn about PM Surya Ghar subsidies, system pricing from 1kW-10kW, and how to reach zero electricity bills.
Read moreRelated guides
Delhi Electricity Rate 2026
BSES & Tata Power per-unit rates, PPAC, subsidy — sourced from DERC.
ExploreDelhi Solar Policy 2026
Free rooftop solar up to 3 kW for homes under 400 units. Eligibility & apply.
ExploreSolar Panel Price in Delhi
Live 2026 rooftop prices in Delhi after ₹1.56L subsidy. 1,200+ installs.
ExploreSolar Company in Gurgaon
Gurgaon's rooftop solar installer — 800+ systems, ₹78K PM Surya Ghar subsidy.
ExploreSolar Company in Noida
Noida & Greater Noida rooftop solar — 500+ installs, ₹1.08L stacked subsidy.
ExploreSolar Panel Price in Faridabad
Live 2026 Faridabad prices after ₹78K PM Surya Ghar subsidy. 350+ homes.
Explore